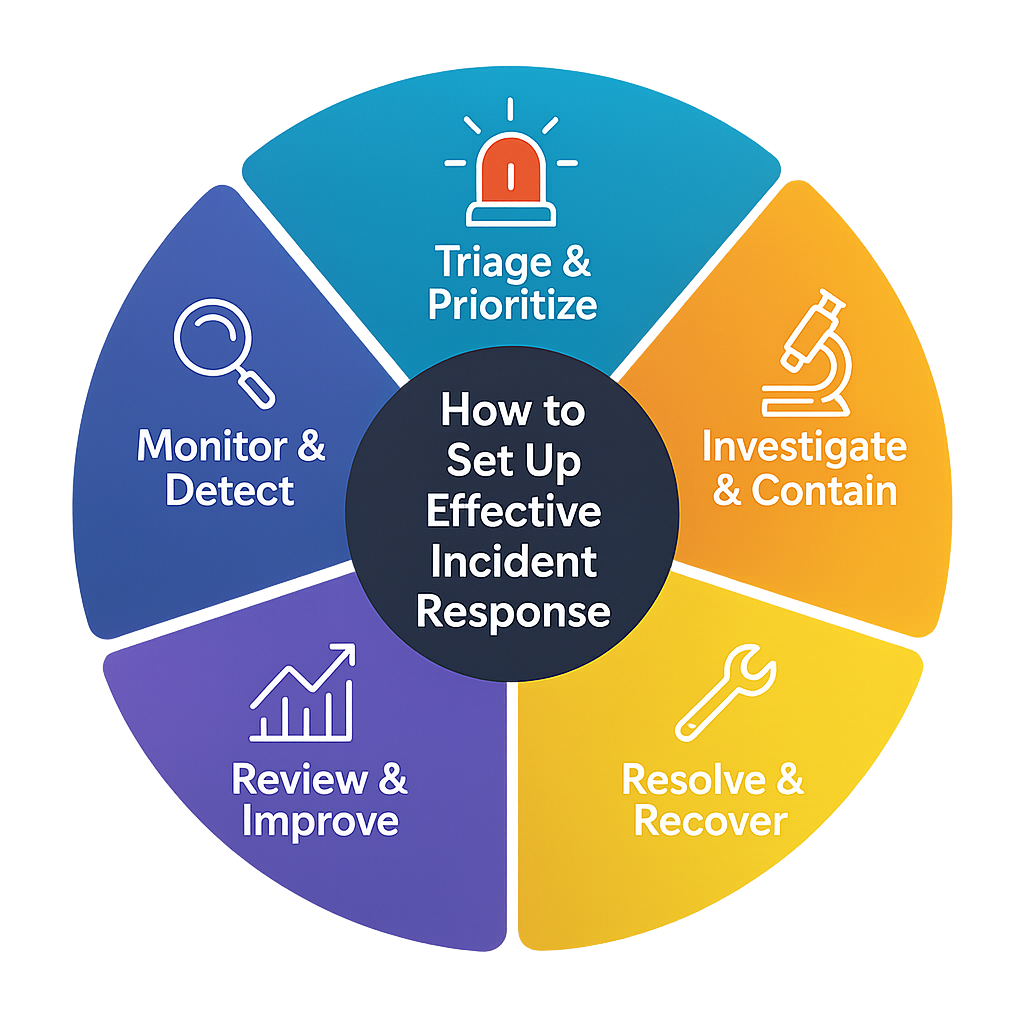
The Foundation of Effective DevOps Monitoring
In the fast-paced world of DevOps, monitoring is not just about keeping an eye on your systems—it's about understanding how your applications perform, identifying potential issues before they become problems, and ensuring optimal user experience.
With so many metrics available, it can be overwhelming to determine which ones truly matter. In this article, we'll focus on the five critical monitoring metrics that every DevOps team should track to maintain healthy, performant applications.
1. Uptime and Availability
Why It Matters
Uptime is the most fundamental metric—if your application isn't available, nothing else matters. Users expect 99.9%+ uptime, and even small amounts of downtime can have significant business impact.
What to Monitor
- Overall Uptime Percentage: Track your application's availability over time
- Mean Time Between Failures (MTBF): Average time between outages
- Mean Time to Recovery (MTTR): How quickly you can restore service
- Geographic Availability: Monitor from multiple locations to ensure global accessibility
Best Practices
- Set up monitoring from multiple geographic locations
- Monitor both HTTP and HTTPS endpoints
- Implement synthetic monitoring for critical user journeys
- Set up automated alerting with escalation policies
2. Response Time and Performance
Why It Matters
Response time directly impacts user experience. Studies show that users expect pages to load in under 2 seconds, and every additional second can significantly impact conversion rates and user satisfaction.
What to Monitor
- Average Response Time: Overall performance across all requests
- 95th and 99th Percentile Response Times: Understand worst-case performance
- Time to First Byte (TTFB): Server processing time
- Page Load Time: Complete page rendering time
- Database Query Performance: Backend processing efficiency
Best Practices
- Set performance budgets and alert when thresholds are exceeded
- Monitor performance trends over time
- Correlate performance with business metrics
- Implement performance monitoring for critical user flows
3. Error Rate and Reliability
Why It Matters
Error rates indicate the health and reliability of your application. High error rates can lead to poor user experience, lost revenue, and damage to your brand reputation.
What to Monitor
- HTTP Error Rates: 4xx and 5xx response codes
- Application Errors: Exceptions and crashes
- Database Errors: Connection failures and query errors
- Third-party Service Errors: External API failures
- Error Distribution: Which endpoints or services are failing most
Best Practices
- Set up error rate thresholds (typically < 1% for 5xx errors)
- Implement error tracking and logging
- Monitor error trends and patterns
- Set up automated rollbacks for critical failures
4. Throughput and Capacity
Why It Matters
Throughput metrics help you understand your application's capacity and scalability. They're essential for capacity planning and ensuring your infrastructure can handle current and future load.
What to Monitor
- Requests Per Second (RPS): Overall application load
- Concurrent Users: Number of active users
- Database Connections: Connection pool utilization
- Queue Lengths: Background job processing
- Bandwidth Usage: Network capacity utilization
Best Practices
- Monitor throughput trends to predict capacity needs
- Set up auto-scaling based on throughput metrics
- Monitor resource utilization alongside throughput
- Implement load testing to understand capacity limits
5. Resource Utilization
Why It Matters
Resource utilization metrics help you understand how efficiently your infrastructure is running and identify potential bottlenecks or waste.
What to Monitor
- CPU Usage: Processor utilization across your servers
- Memory Usage: RAM utilization and potential memory leaks
- Disk I/O: Storage performance and bottlenecks
- Network I/O: Network bandwidth utilization
- Database Performance: Query execution times and connection pools
Best Practices
- Set up resource utilization alerts (typically 80-85% thresholds)
- Monitor resource trends over time
- Correlate resource usage with application performance
- Implement resource optimization strategies
Implementing a Comprehensive Monitoring Strategy
Step 1: Define Your Monitoring Goals
Before implementing any monitoring, clearly define what you want to achieve:
- What constitutes acceptable performance for your application?
- What are your business-critical user journeys?
- Who needs to be notified when issues occur?
- What actions should be taken during incidents?
Step 2: Set Up Baseline Monitoring
Start with the five critical metrics outlined above:
- Implement uptime monitoring from multiple locations
- Set up response time monitoring for key endpoints
- Configure error rate monitoring and alerting
- Monitor throughput and resource utilization
Step 3: Implement Intelligent Alerting
Set up smart alerting to avoid alert fatigue:
- Use different thresholds for different times of day
- Implement alert deduplication
- Set up escalation policies
- Use multiple notification channels
Step 4: Continuously Improve
Regularly review and optimize your monitoring strategy:
- Analyze false positives and adjust thresholds
- Add new metrics based on business needs
- Optimize alerting rules and escalation policies
- Train your team on monitoring best practices
Advanced Monitoring Considerations
Business Metrics Integration
Correlate technical metrics with business outcomes:
- Conversion rates during performance issues
- Revenue impact of downtime
- User satisfaction scores
- Support ticket volume
Predictive Monitoring
Use historical data to predict potential issues:
- Trend analysis for capacity planning
- Anomaly detection for unusual patterns
- Seasonal performance patterns
- Predictive maintenance for infrastructure
Conclusion
Effective monitoring is the foundation of successful DevOps practices. By focusing on these five critical metrics—uptime, response time, error rate, throughput, and resource utilization—you'll have a solid foundation for understanding your application's health and performance.
Remember that monitoring is not a one-time setup but an ongoing process. Continuously review your metrics, adjust your thresholds, and evolve your monitoring strategy as your application and business needs change.
Ready to implement comprehensive monitoring for your applications? Start your free trial with KeepWatch and get professional-grade monitoring up and running in minutes.